According to the latest issued by the Bureau of Labor Statistics (BLS), the total number of jobs in the U.S. increased by +210,000 in November.��
Frankly, +210,000 is a disappointing figure. Canada’s change in employment in November wasn’t much lower, at +154,000 jobs. And the size of Canada’s labor force is much smaller.
Furthermore, while Canada has recovered all the drop in its total employment level that transpired from February to April of last year, when the initial flare-up of COVID-19 led to a near economy-wide closure, the U.S. has clawed back just 82.2% of its Spring 2020 plunge.
Canada’s jobs ‘claw-back’ ratio of 106.2% means the nation has gone beyond restoring lost employment and is now on a path of extra jobs creation. ��
Perhaps the biggest difference between the two economies lies in public sector employment. The level of total government-tied jobs in Canada is now higher than before the pandemic.
Positions with the U.S. government, however, remain well below where they were in the first couple of months of 2020, The U.S. government jobs ‘claw-back’ ratio is a meager 7.3%.
The U.S. sectors with the largest nominal employment gains in November were ‘professional and business services’, +90,000 jobs, and ‘transportation and warehousing’, +50,000 jobs. The latter is welcome news given the supply chain breakdown issues that are lighting up the newswires and sparking decades-high inflation.���� ��
‘Leisure and hospitality’, in November, turned in a lackluster jobs gain of just +23,000. ‘Education and health’ added only +4,000 jobs.
On the downside, the ‘retail’ sector shed -20,000 jobs. And ‘government’ payrolls shrank by -25,000 jobs.
The construction and manufacturing sectors increased their staffing by the same amount, +31,000 jobs each.
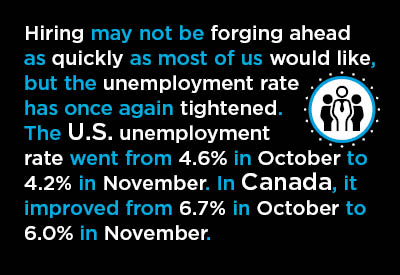
Hiring may not be forging ahead as quickly as most of us would like, but the unemployment rate has once again tightened. The seasonally adjusted (SA) U rate went from 4.6% in October to 4.2% in November. The not seasonally adjusted (NSA) U rate stiffened from 4.3% to 3.9%.
Low unemployment rates are finding a counterpart in wage strength. For ‘production and nonsupervisory’ personnel in ‘all jobs’, November’s year-over-year compensation gains were +5.9% hourly and +5.6% weekly’. �鶹��ý����ion workers as a subset of ‘all jobs’ earned +5.3% y/y hourly and +6.4% y/y weekly.
For all workers, including ‘supervisory personnel’ (i.e., bosses), the hourly and weekly earnings advances for ‘all jobs’ and construction workers specifically were +4.8% y/y across the board.
North of the border, and according to , the SA unemployment rate improved from 6.7% in October to 6.0% in November. The NSA unemployment rate, when calculated on a same methodological basis as in the U.S., went from 4.8% in the prior month to a present figure of 4.5%. (4.5% U for Canada is but a small step behind the 3.9% for the U.S.)
Manufacturing employment in Canada jumped by +35,000 jobs. �鶹��ý����ion employment, though, barely registered a pick-up, +1,000 jobs.��
The major services-related contributors to Canada’s jobs gains in the latest month were ‘health care and social assistance’, +44,000; ‘wholesale and retail trade’, +28,000; and ‘professional, scientific, and technical services’, also +28,000.
The month-to-month jobs increases of some other important sectors were: ‘transportation and warehousing’, +18,000; ‘accommodation and food services’, +5,000; and ‘public administration’ +10,000.
Provincially, the bulk of Canada’s total jobs increase of +157,000 in November was borne by Ontario, +68,000. Quebec also made a good contribution to the national employment upswing, +46,000 jobs. Quebec, among the provinces, can also boast of having Canada’s lowest unemployment rate, 4.5%. ��
Graph 1: U.S.: Month-to-month Total Jobs Count Change
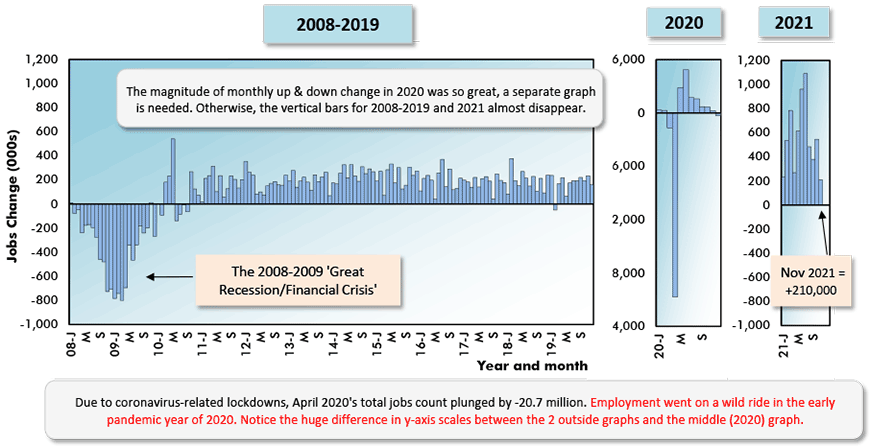
Chart: �鶹��ý����Connect.
Table 1: Monitoring the U.S. Employment Recovery – November 2021
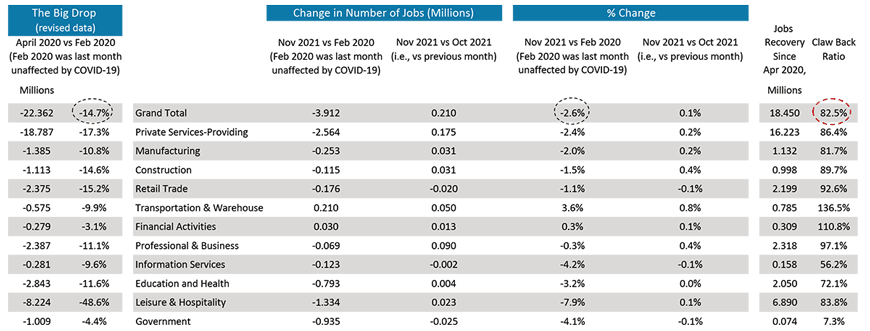
Chart: �鶹��ý����Connect.
Graph 2: Change in Level of U.S. �鶹��ý����ion Employment, Month to Month (M/M) −
Total & by Categories – November 2021
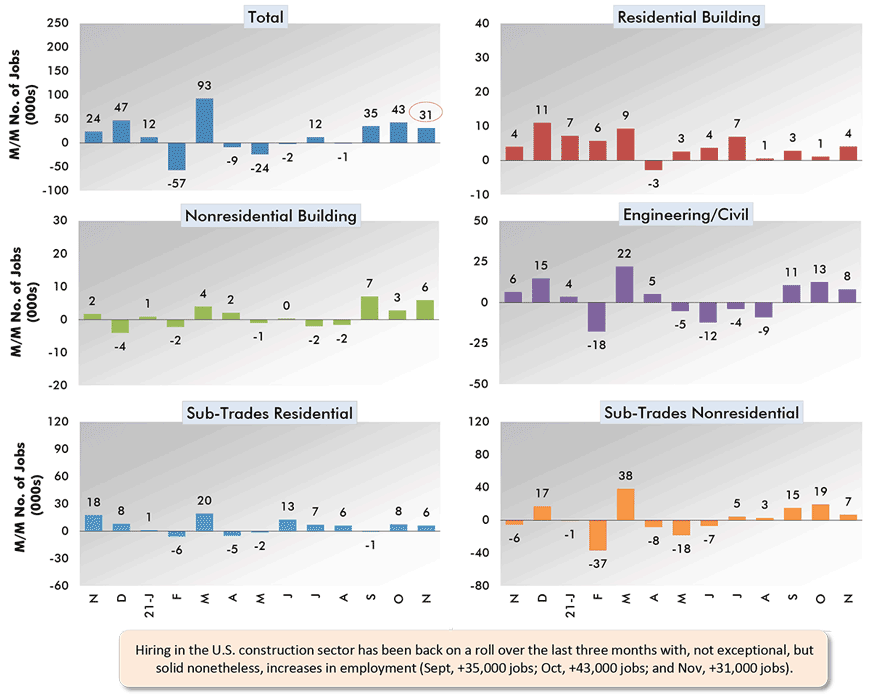
Chart: �鶹��ý����Connect.
Graph 3: Canada: Month-to-month Total Employment Change
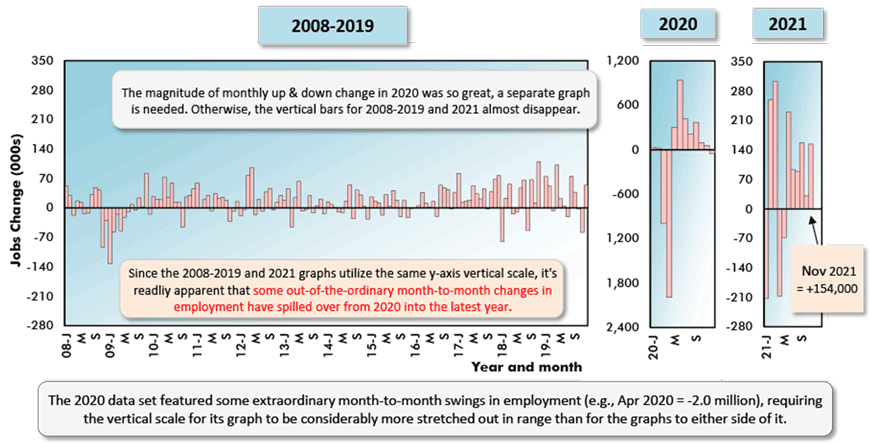
Chart: �鶹��ý����Connect.
Alex Carrick is Chief Economist for �鶹��ý����Connect. He has delivered presentations throughout North America on the U.S., Canadian and world construction outlooks. Mr. Carrick has been with the company since 1985. Links to his numerous articles are featured on Twitter , which has 50,000 followers.


Recent Comments
comments for this post are closed